The Ecological Landscape Analysis Report Finder web site provides users the ability to easily find and download information on an EcoDistrict. Simply click on the screen and follow the links in the pop-up dialog box to view and download PDF reports on the EcoDistrict.
NOTE: Data projection is WGS84 Web Mercator (Auxiliary Sphere).
A printable version of the help documentation can be found by clicking Here.
1.2 Disclaimer |
|
|
|
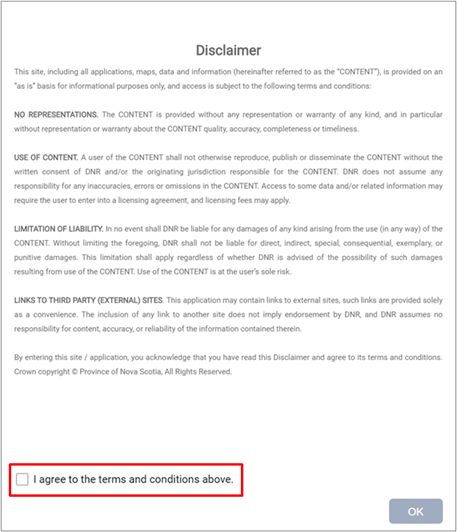
When the user first enters the site, the Disclaimer will be presented. By clicking I agree to the terms and conditions above indicated in red on the image to the left, the user accepts the use of the web site with the terms and conditions as set out in the disclaimer. |
1.3 Screen Overview |
|
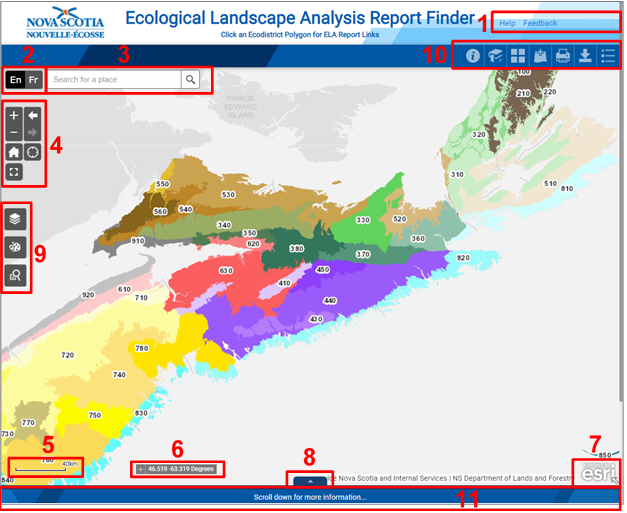
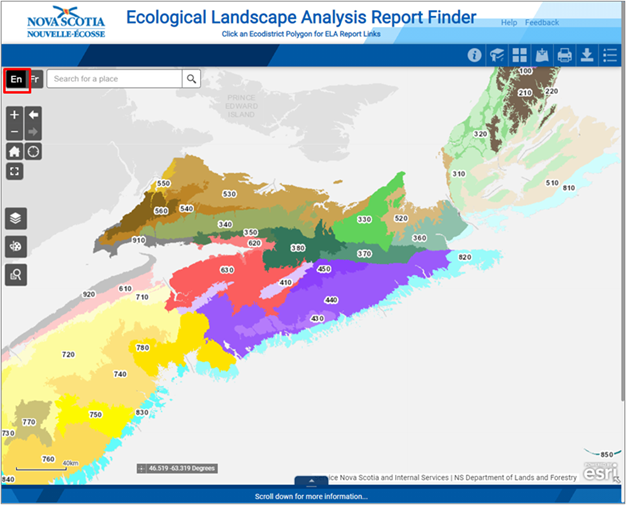
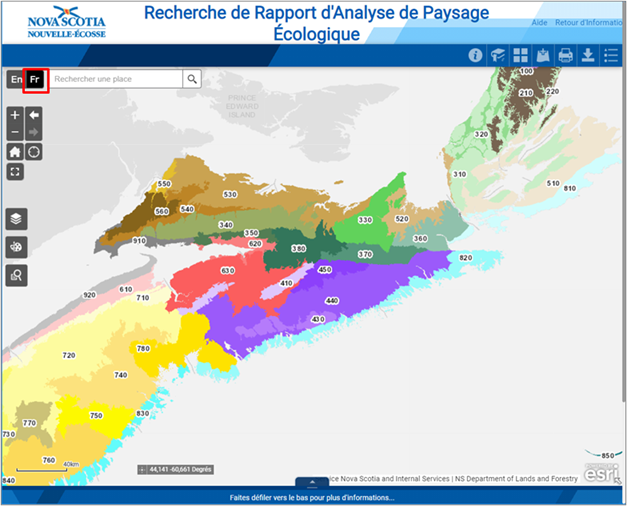
Once the user acknowledges the Disclaimer screen, the site will open with the Province of Nova Scotia centered within the window. The image below shows the main components of the viewer and identifies the key functions and features available to the user.
|
1. Links |
5. Scale Bar |
|
|
Links to the website help and other resources.
|
The metric scale or block bar. |
Includes: Layer List, Draw, and Enhanced Search. |
|
2. Language |
10. Top Toolbar |
|
|
Switch between English (En) and French (Fr) languages. |
The current coordinates of the mouse cursor. |
Includes: About, Bookmarks, Basemap Gallery, Add Data, Print, Save Session, and Legend. |
|
3. Search |
7. Map Overview |
|
|
Search for a location, place or civic address. |
Expands a window showing the outline of your map in relation to the province. |
Contains additional information on the website when you scroll down. |
|
4. Navigation |
|
|
|
Includes: Zoom In/Out, Previous/ Next Extents, Home, My Location, and Full Screen. |
Exposes the various attribute tables for the visible layers. |
|
2.0 Map Canvas Tools |
|
2.1 Identify |
|
|
|
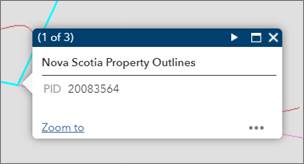
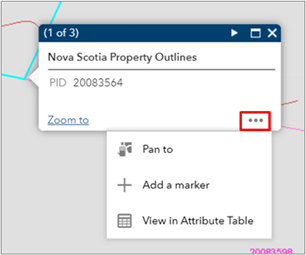
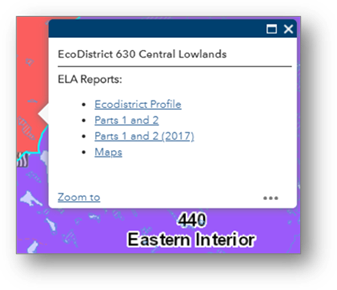
At any time, the user can click on features on the map to display attribute information for the selected feature. The outline of the selected feature will be highlighted, and a small window will display the relevant attributes and allow the user to Zoom to the result. |
|
|
|
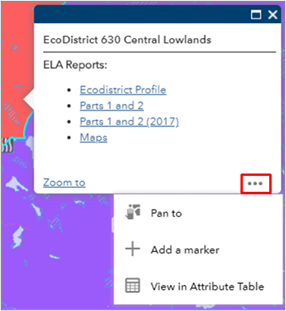
Click the ellipsis (...) indicated in red on the image to the left to expand the options, which include Pan to, Add a marker, and View in Attribute Table. |
|
|
|
|
Click the ellipsis (...) indicated in red on the image to the left to expand the options, which include Pan to, Add a marker, and View in Attribute Table. |
2.2 Language Bar |
|
|
The website allows the user to change languages using the language bar. The current options are English (En) and French (Fr).
|
|
The image to the left shows the website in English (En) mode as indicated in red. All text, links, and tool tips are in the selected language. |
|
The image to the right shows the website in French (Fr) mode as indicated in red. All text, links, and tool tips are in the selected language. |
|
2.3 Search / Locate |
|
|
|
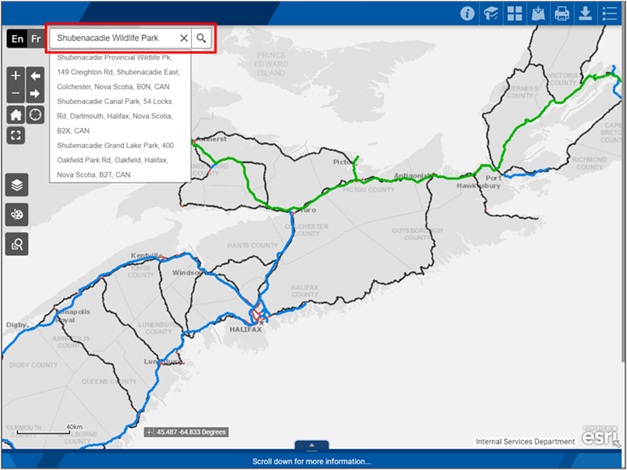
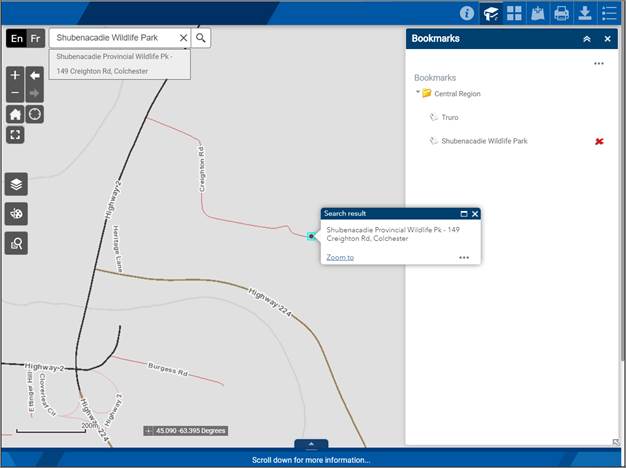
Use the Search / Locate widget indicated in red on the image to the right to search for a location, address, point of interest, etc. and be zoomed into that point. It is important to note that the location searched is for all of Canada, so be as specific as possible. An autocomplete list box will appear with choices to select. For example, type Shubenacadie Wildlife Park and click the magnifying glass on the right to retrieve features associated with the search text. |
|
|
|
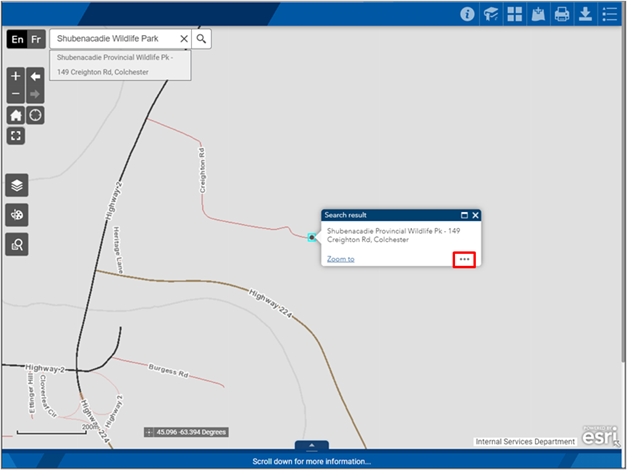
The search example was specific enough that only one result was returned. A results pop-up will appear on screen allowing the user to Zoom to the results. Click the ellipsis (...) indicated in red on the image to the left revealing the Pan to and Add a marker tools. The example on the left shows the result zoomed in with a marker placed for future reference. |
|
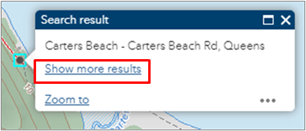
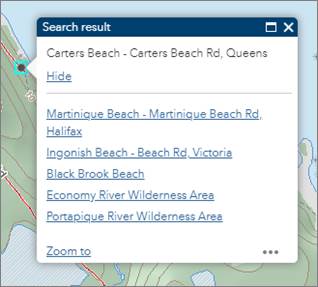
The search tool can return multiple search results, for example, type Parks, NS to retrieve a list of related locations. The tool will automatically zoom to the first result in the list. |
|
|
|
Click Show more results indicated in red on the image above to expand the list and zoom to additional results. |
2.4 Navigation |
|
2.4.1 Zoom In / Zoom Out |
|
|
Incrementally zoom the map in or out with each click.
2.4.2 Previous / Next Extent |
|
|
Change to the previous or next extent.
2.4.3 Home |
|
|
Sets the map to the full extent (returns to the full map of Nova Scotia and centres the map in the window).
2.4.4 My Location |
|
|
Sets the map to the full extent (returns to the full map of Nova Scotia and centres the map in the window).
2.4.5 Full Screen |
|
|
View the website in full screen mode. The ESC key cancels
the full screen mode.
2.4.6 Mouse and Keyboard Shortcuts |
|
|
The following table describes the most common map action shortcuts.
|
Action |
Shortcut |
Description |
|
Pan |
Click and Drag |
To move the map, click and drag the left mouse button and drag the map to a new place. |
|
Zoom In |
Shift + Click and Drag |
This allows the user to draw a box to zoom in to the map. |
|
Zoom Out |
Ctrl + Shift and Drag |
This allows the user to draw a box to zoom out of the map. |
|
Zoom In/Out |
Mouse Scroll Wheel |
Scroll the mouse wheel up to zoom in to the map, and scroll the mouse wheel down to zoom out of the map. The pointer of the mouse on the map acts as the centre point while zooming. |
2.5 Scale Bar |
|
|
|
|
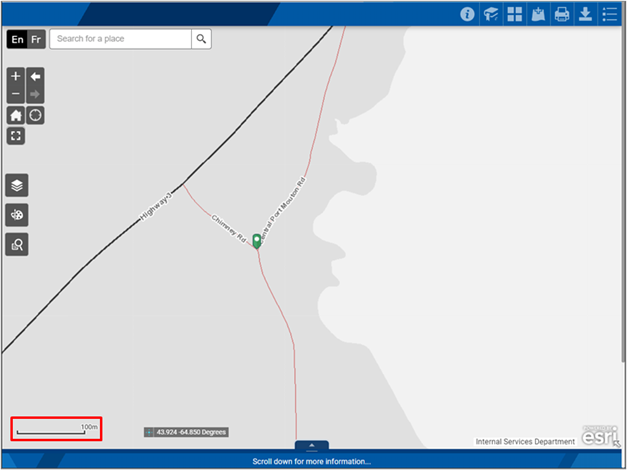
The scale bar shows the set distance on the map represented by a black bar with ticks on each end (referred to as a block or bar) and is indicated in red on the image to the left. The block or bar is metric and will change from metres to kilometres depending on the scale. |
2.6 Coordinate Bar |
|
|
|
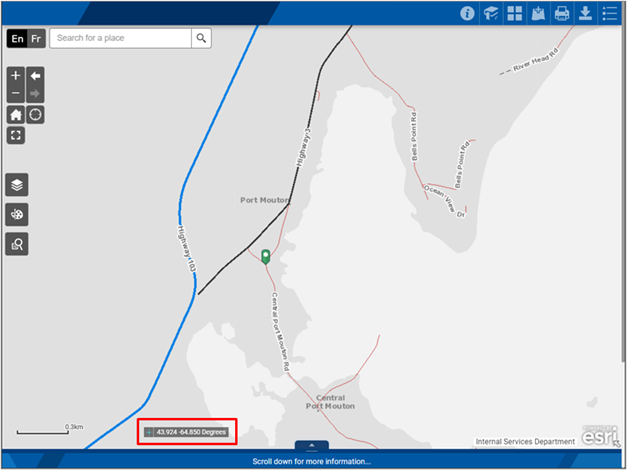
The coordinate bar indicated in red on the image to the
right shows the location of the mouse cursor in WGS 1984 Latitude, Longitude
Degrees format. To find the coordinates of a specific point on the map, click
the button |
|
2.7 Map Overview |
|
|
|
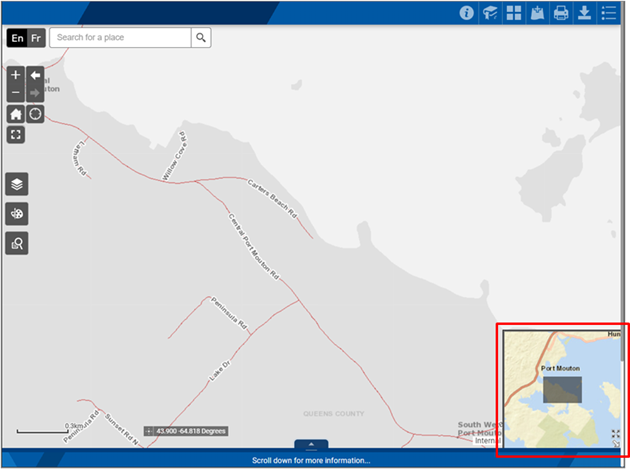
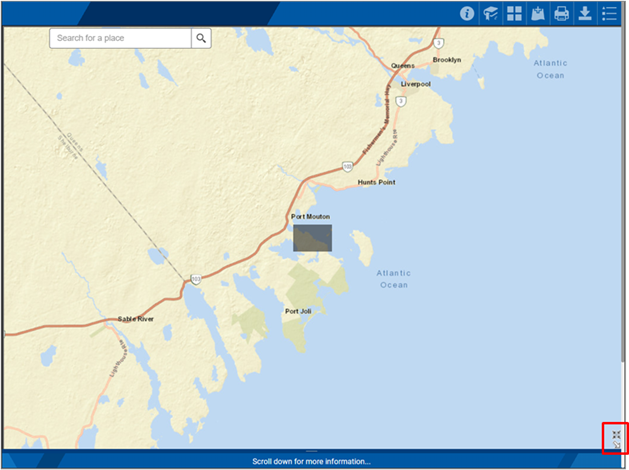
The Map Overview widget is the arrow at the bottom-right side of the map canvas next to the Powered By esri icon. Clicking the arrow opens a small window of the map with a small dark-grey box in the middle as indicated in red on the image to the right. The grey box represents the location of the map canvas. Click and drag the dark grey box to reposition the main map. |
|
|
|
Clicking the After repositioning the grey box, the overview will
automatically return to the corner of the screen. At any time, the user can
shrink the overview map by clicking the |
2.8 Attribute Table |
|
|
|
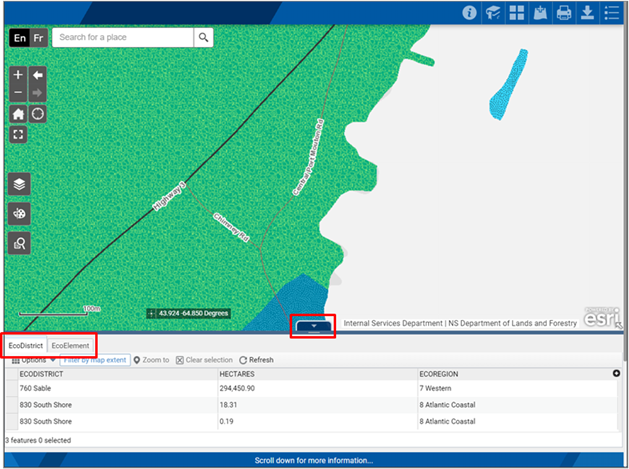
The Attribute Table widget can be opened by clicking on
the navy-blue tab with the grey arrow at the bottom of the map canvas as
indicated in red in the centre of the image to the right ( Please try not to open the Attribute Table widget when zoomed to the provincial level. Zoom into an area of interest first. If you are zoomed in and no records appear in the table, check the Layer List and make sure that the required layer is turned on and visible (i.e. zoomed in until it becomes visible). The tabs (as indicated in red on the left side of the image to the right) show the visible layers. Click on a tab to see the corresponding attribute table. |
|
|
|
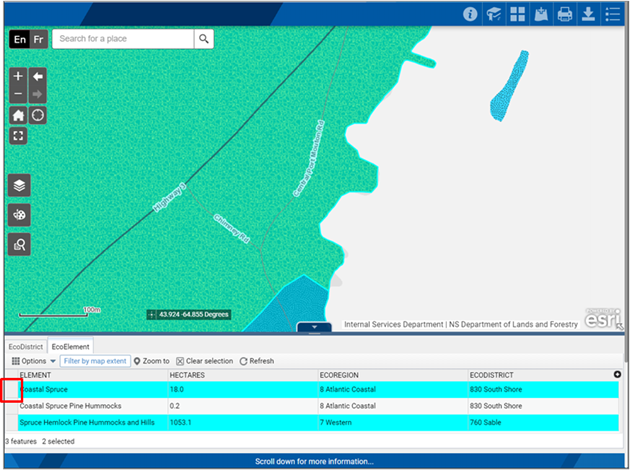
Single-clicking the grey box (indicated in red on the image to the left) on the left of any row in the table will select it. Alternatively, hold down the Shift or Ctrl key while clicking to make multiple selections. You can click Clear selection to deselect the rows. Clicking on Options allows you to Filter, Show/Hide columns, or Show selected records only. Clicking Filter by map extent will include all records in the list for the entire province. Click it again to return to showing only records within your map canvas view. Zoom to will zoom out or in until all records and their areas are shown in the map canvas view. |
|
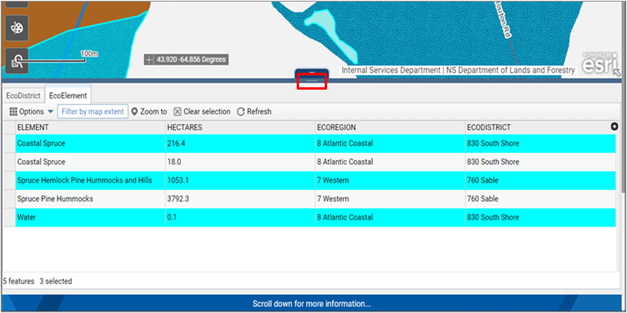
The table can be expanded or shrunk by holding the left mouse button down when you are over the grey line below the tab indicated in red on the image to the right. To close the attribute Table widget, simply click the tab
|
|
3.0 Canvas Toolbar |
|
3.1 Layer List |
|
|
3.1.1 Layer Selection |
|
|
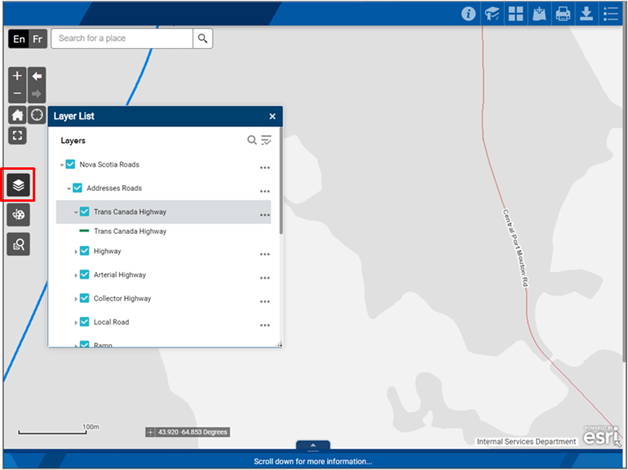
The layers shown in the Layer List indicated in red on the image to the right are available for display by clicking the check box next to the layer you wish to see. Individual layers, or all layers in a layer group, ex. Nova Scotia Roads, can be turned on or off this way. Not all layers are visible at all zoom levels. Some layers are scale dependent and will turn on or off depending on the display scale of the map. Layers that are available for display at the current scale will appear in darker text. Layers that cannot be displayed at the current scale will appear in a fainter text. You can expand or collapse the Layer groups by clicking anywhere on the layer group name. You can also see the legend for a layer when it is expanded to its lowest level, as shown for the Addressed Roads layer in the image to the right. |
|
3.1.2 Layer Transparency |
|
|
|
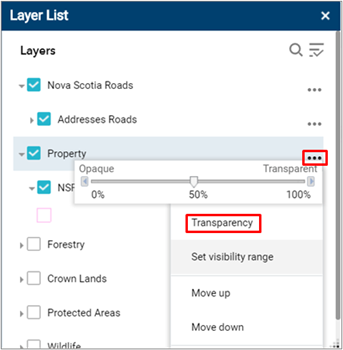
In the Layer List, click the elipsis (...), as indicated in red on the image to the left, on the far right of any top-level layer group and choose Transparency to display a slider bar. Move the slider arrow from Opaque to Transparent to make the layer(s) more transparent. This will allow you to see the information for multiple layers and/or the underlying base layer as needed. |
3.1.3 Layer Reference |
|
|
Layer Name |
Description |
|
Roads |
A simplified road network for the Province of Nova Scotia. |
|
Property |
Property information for the Province of Nova Scotia. |
|
Water |
A simplified hydrology network for the Province of Nova Scotia. |
|
EcoDistrict |
EcoDistrict level of the Ecological Land Classification (ELC Version 2015). |
|
3.2 Draw |
|
|
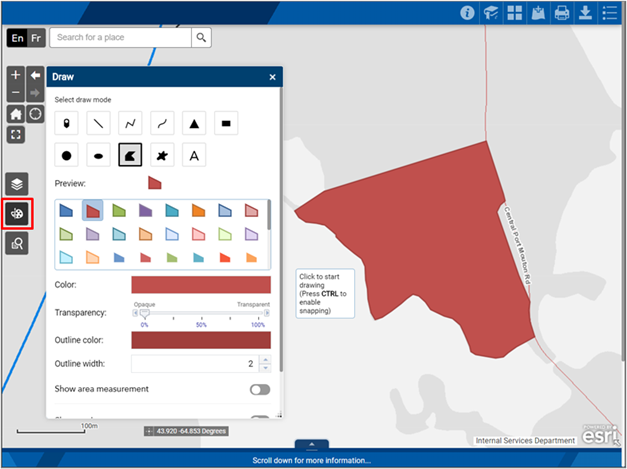
The Draw widget (indicated in red on the image below) allows you to mark-up the map. Common activities using the tool include drawing areas of interest, adding text, etc. The available draw modes can be seen in the image below. Use the mouse cursor to hover over the individual buttons to see the tooltip.
|
When you select a draw mode (polygon in this case), the options available for that mode are shown. Color, Transparency, Outline color, and Outline width can be modified. Clicking the mouse will start to build the polygon, and double-clicking will finish the sketch. |
|
|
|
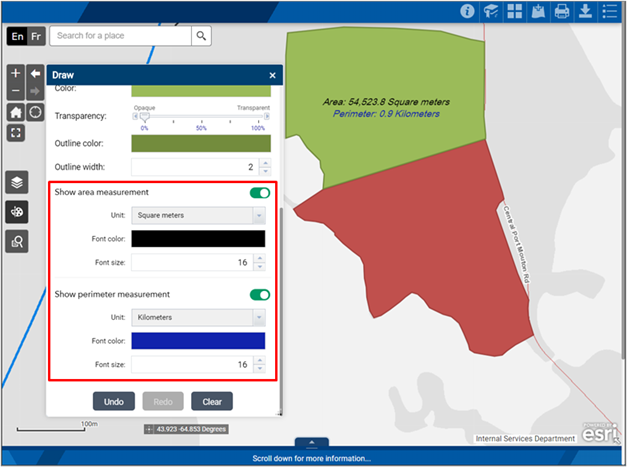
Clicking Show area measurement and Show perimeter measurement as indicated in red on the image to the left allows you to specify your measurement units, font colour and size. Once you finish the sketch, it will be labeled with that information. |
If you make a mistake while you are creating the sketch, hit Esc to cancel, or if the sketch is complete, click the Undo button. To clear your sketches, click the Clear button.
3.3 Query |
|
|
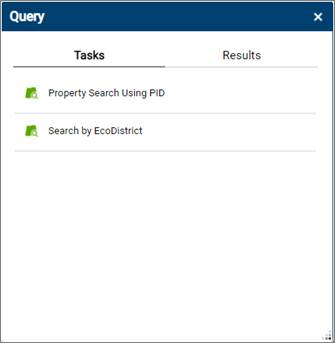
The primary use of the Query tool is to allow the user to zoom into a known area quickly. When the Query widget is clicked, a Query window is displayed with one or more query tasks. Click on a task to execute a query.
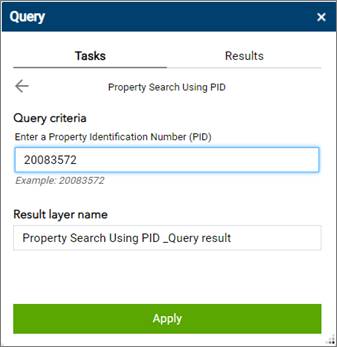
3.3.1 Property Search Using PID |
|
The Property Search Using PID method allows you to enter the Property IDentification number and return the resulting property.
|
Enter the PID number into the textbox and click Apply to return the result. |
|
|
|
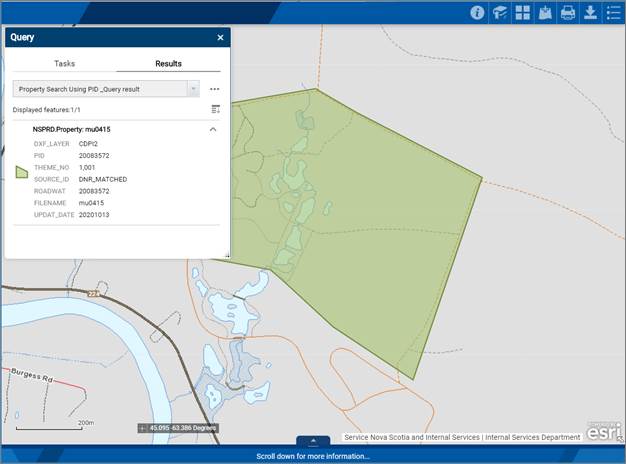
The results returned are in the Results tab and are shown on the map highlighted in green. |
|
|
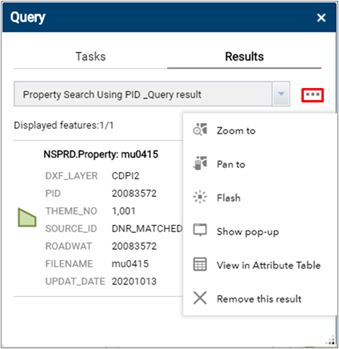
Click the ellipsis (...), as indicated in red on the image to the left to select from a dropdown list of advanced options. |
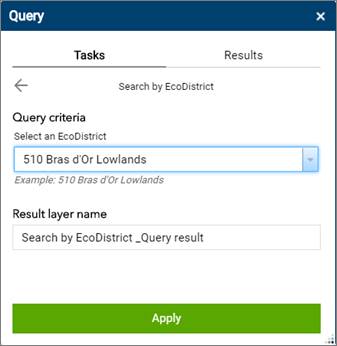
3.3.2 Search by EcoDistrict |
|
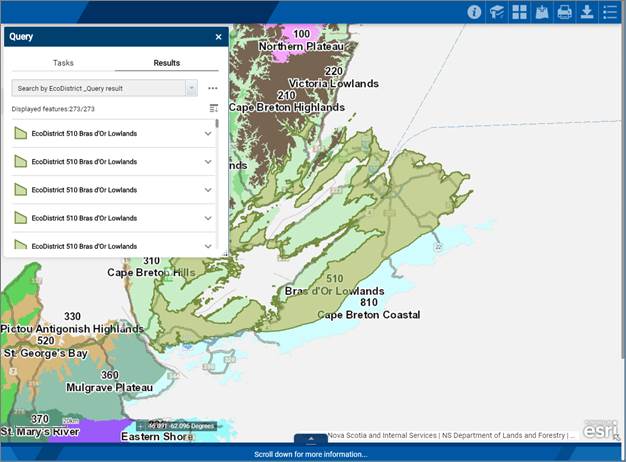
The Search by EcoDistrict method allows you to select an EcoDistrict from a dropdown list and return the resulting EcoDistrict.
|
Select the EcoDistrict from the dropdown list and click Apply to return the result. |
|
|
|
The results returned are in the Results tab and are shown on the map highlighted in green. |
|
|
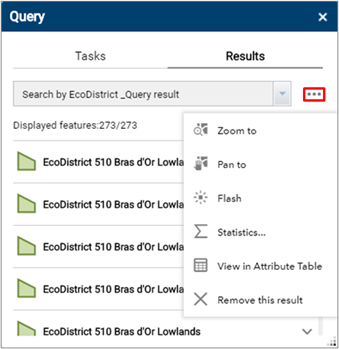
Click the ellipsis (...), as indicated in red on the image to the left to select from a dropdown list of advanced options. |
4.0 Top Toolbar |
|
4.1 Common Functionality |
|
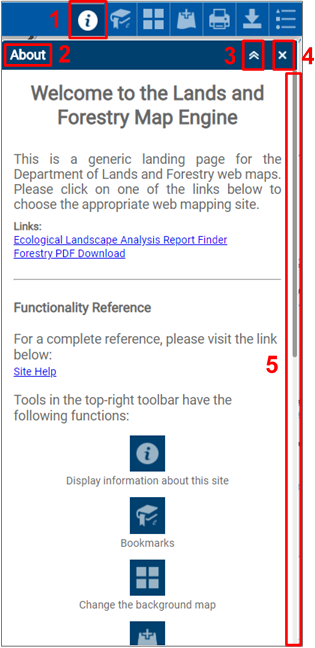
All the top toolbar widgets share some common functionality. They have been listed from 1-5 corresponding to the image below:
|
|
|
4.2 About |
|
|
|
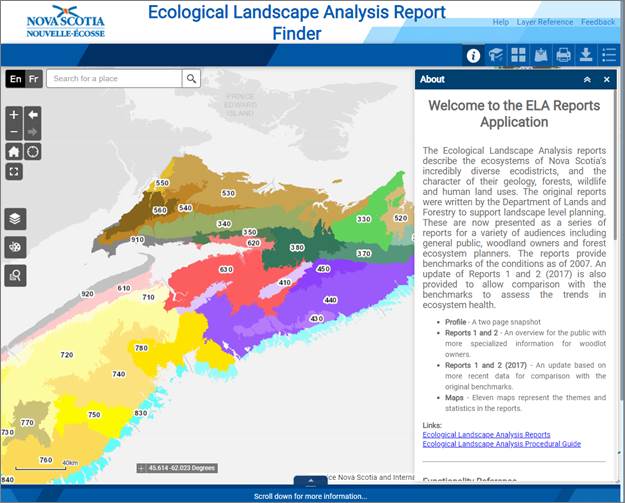
The About widget contains basic information about the site, including a link to this help documentation. Clicking a link opens a new window automatically. |
|
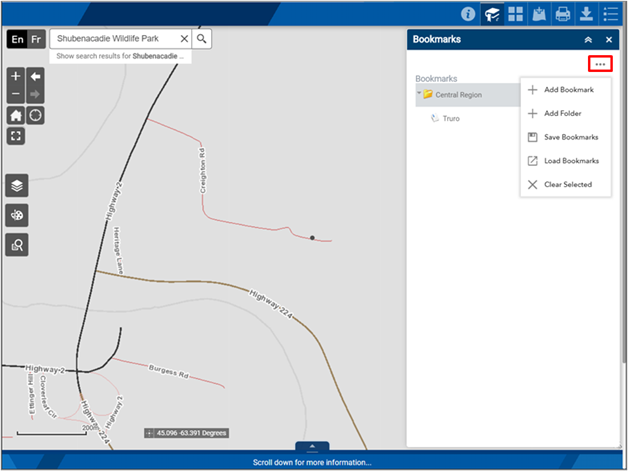
4.3 Bookmarks |
|
|
|
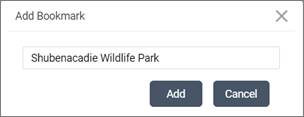
|
The Bookmarks widget allows you to save your current location and zoom level. You can create a folder and add a bookmark into that folder. The available bookmark options are available by clicking the ellipsis (...) as indicated in red on the image to the left. I added (Add Bookmark) Shubenacadie Wildlife Park to my Central Region folder (Add Folder).
You can Save Bookmark as a file onto your computer and can alternately Load Bookmark file into any session on any computer to retrieve your bookmarks. |
|
The bookmark can be deleted by clicking on the Delete
button |
|
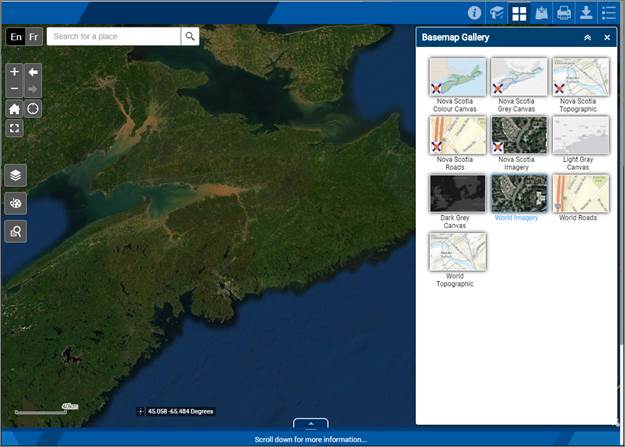
4.4 Basemap Gallery |
|
|
|
|
The Basemap Gallery allows you to choose between various base maps. The most used base maps are: Nova Scotia Grey Canvas, Nova Scotia Topographic, Nova Scotia Roads, and Nova Scotia Imagery. To select a new basemap, simply click on the one you wish to use. |
The following table provides descriptions of each basemap presented in the Basemap Gallery. The basemap increases and decreases in level of detail as the user changes the zoom levels.
|
|
The Nova Scotia Colour Canvas is the default base map for the Provincial Landscape Viewer. |
|
|
The Nova Scotia Grey Canvas is a low-distraction base map for the Provincial Landscape Viewer. |
|
|
The Nova Scotia Topographic base map is maintained by the Nova Scotia Geomatics Centre and has a high level of topographic detail for Nova Scotia. |
|
|
Nova Scotia Roads is a detailed street map maintained by the Nova Scotia Geomatics Centre. The basemap includes Nova Scotia infrastructure like highways, major roads, minor roads, direction indicators, water features, cities, parks and landmarks. |
|
|
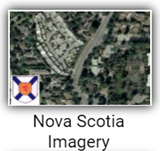
Nova Scotia Imagery is maintained by the Nova Scotia Geomatics Centre. Nova Scotia aerial photography is presented. |
|
|
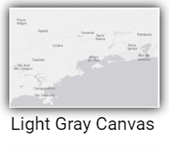
Created by ESRI, the Light Gray Canvas basemap provides a less distracting backdrop so you can focus on your data. Important features like roads are still displayed in a subtle manner. |
|
|
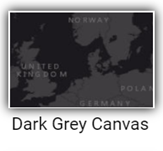
The Dark Gray Canvas is also published by ESRI and is like the Light Gray Canvas basemap, except it is in a Dark Mode format. The Dark Gray Canvas basemap is useful to use when you wish to reduce eye strain. |
|
|
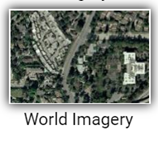
World Imagery presents the user with detailed satellite imagery amalgamated by ESRI from various sources. The level of detail varies, with urban and suburban areas having higher detailed imagery than rural areas. |
|
|
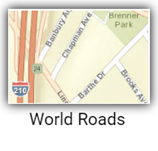
World Roads is a comprehensive street map published by ESRI that include highways, major roads, minor roads, direction indicators, water features, cities, parks and landmarks. |
|
|
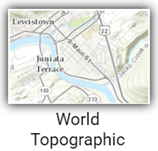
The World Topographic basemap is published by ESRI and contains a good topographic representation of the world. |
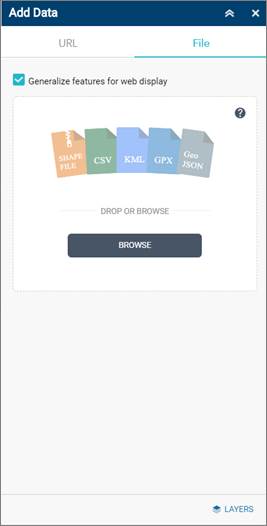
4.5 Add Data |
|
|
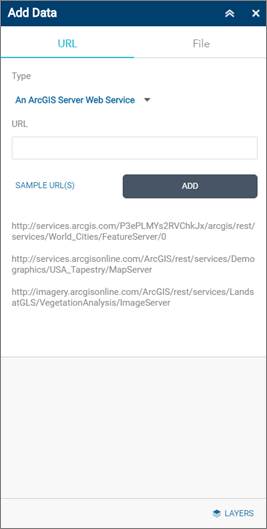
The Add Data widget allows you to add many kinds of layers and data to the map.
|
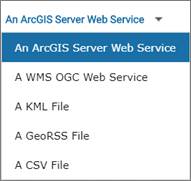
The URL tab lets you add a service from a MapServer. Click on the SAMPLE URL(S) link to expand the samples to input the correct format. Other options are available if you click on the Type. A drop-down list will appear with different options for you to choose from.
|
|
|
|
The File tab allows you to upload files in different formats. The most common file type is the esri shapefile. Clicking on the help button For example, a shapefile needs to have at least a .DBF, .SHP, and .SHX file zipped together in one zip file. Simply click BROWSE and select your file to upload to the map. |
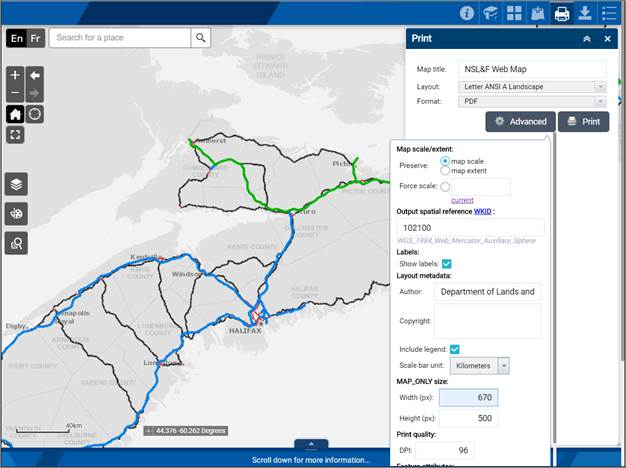
4.6 Print |
|
|
|
This feature allows the user to print a map with all the information displayed on the screen. The Layout drop-down list allows you to select from various page layout options, i.e. Letter or Tabloid page size, Portrait or Landscape, etc. The Format drop down list allows you to select from various output file formats such as PDF, JPG, GIF, or EPS. The Advanced button allows you to set additional features such as the map size, print quality, or include a legend. |
|
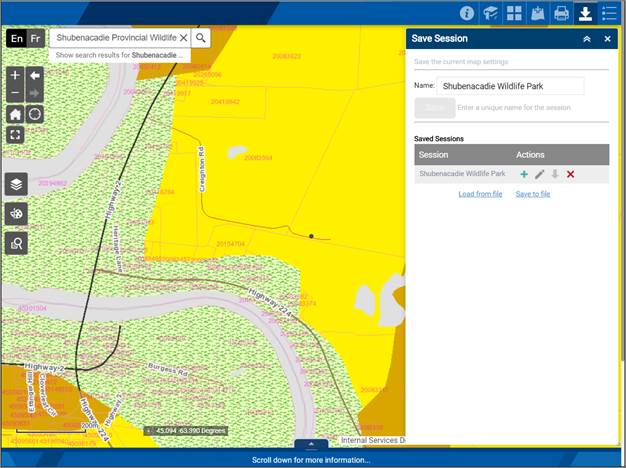
4.7 Save Session |
|
|
|
|
The Save Session widget lets you save your entire session and export it as a file. You can save the area and zoom level, which layers are turned on or off, transparency, etc. The widget makes it ideal to send the saved session file to another web user so they may have the exact setup as you. In the screenshot to the left, I created a new session named Shubenacadie Wildlife Park. Click Save and it will be saved in the Saved Session list. You now have several options available. You can Load Save to file allows you to save the whole session list to a file in the JSON format. Alternatively Load from file allows you to load a JSON session list file. |
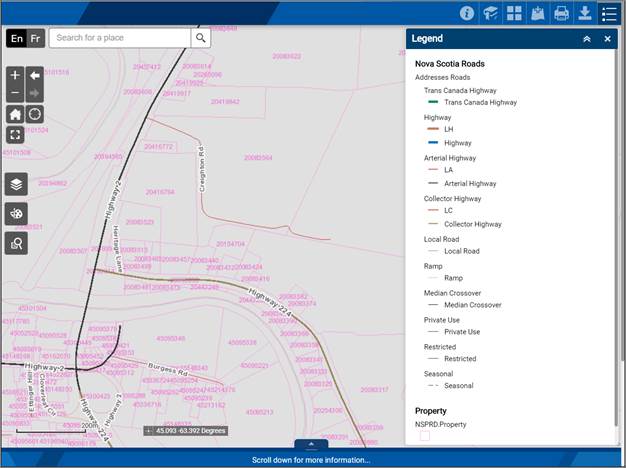
4.8 Legend |
|
|
|
The Legend describes what each colour or symbol on the map represents. Some layers are scale dependant and will turn on or off depending on the display scale of the map. The items shown in the Legend will change as the map scale changes with more layers becoming visible as you zoom in and less as you zoom out. Use the scroll bar on the right side of the Legend to move up or down and see the full list of layers and items in the Legend. |
|
5.0 Additional Information |
|
|
|
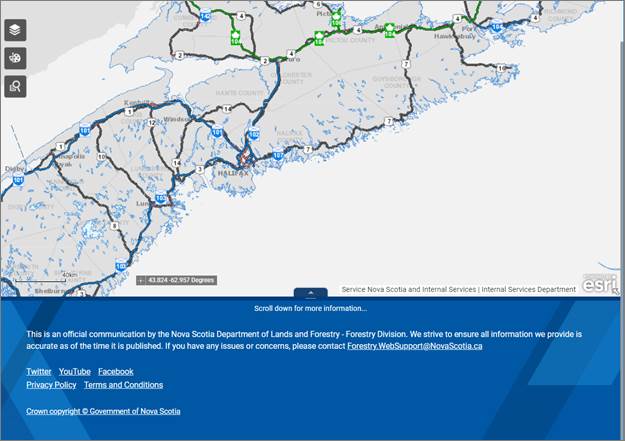
If you scroll down to expose the footer of the web page, additional information is shown including the website author, copyright, privacy policy, terms and conditions, and the Province of Nova Scotia social media links. |
End of Document |
|